


The homepage continues to serve as the central entry point to the site, accounting for over 12,000 views and more than 10,000 active users. Users spend an average of just 11 seconds on the homepage — an indicator that many are scanning quickly or bouncing without exploring further.
The Program Details page is a key engagement driver, with over 2,700 views and a significantly higher average engagement time of 1 minute and 1 second. This suggests that once users arrive on this page, they are highly engaged and willing to invest time in understanding the offering.
Similarly, the Education page saw solid engagement, a strong sessions-per-user ratio of 1.51, and an average time on page of 51 seconds. These metrics suggest that visitors are meaningfully interacting with content related to learning outcomes or curriculum.
/ (Homepage)
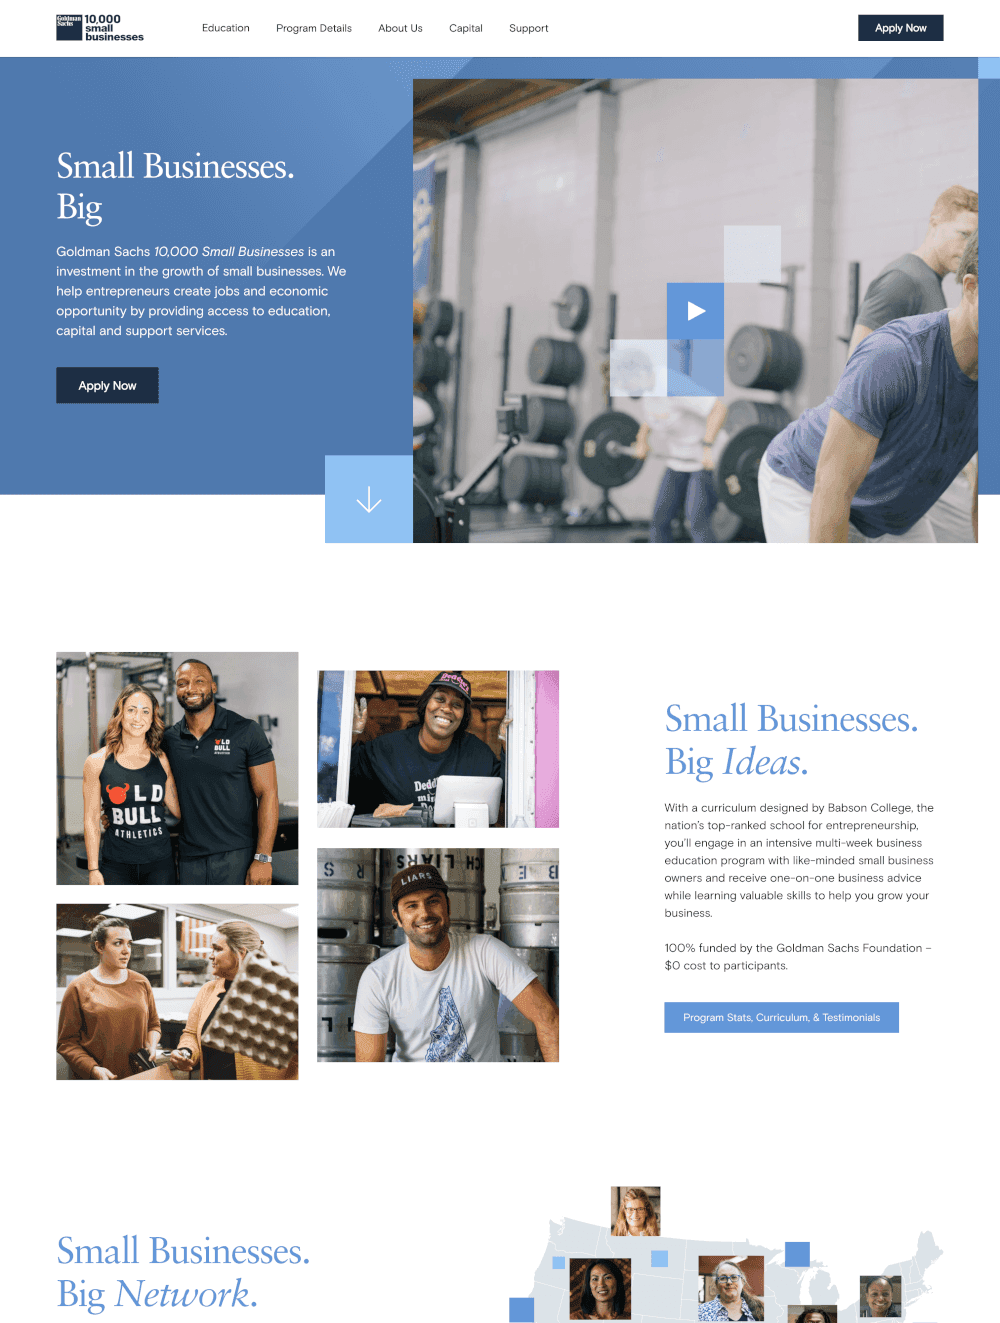
12,174
Views
10,221
Active Users
1.19
Sessions
11s
AVG Engagement Time
40,962
Events
/Program-Details
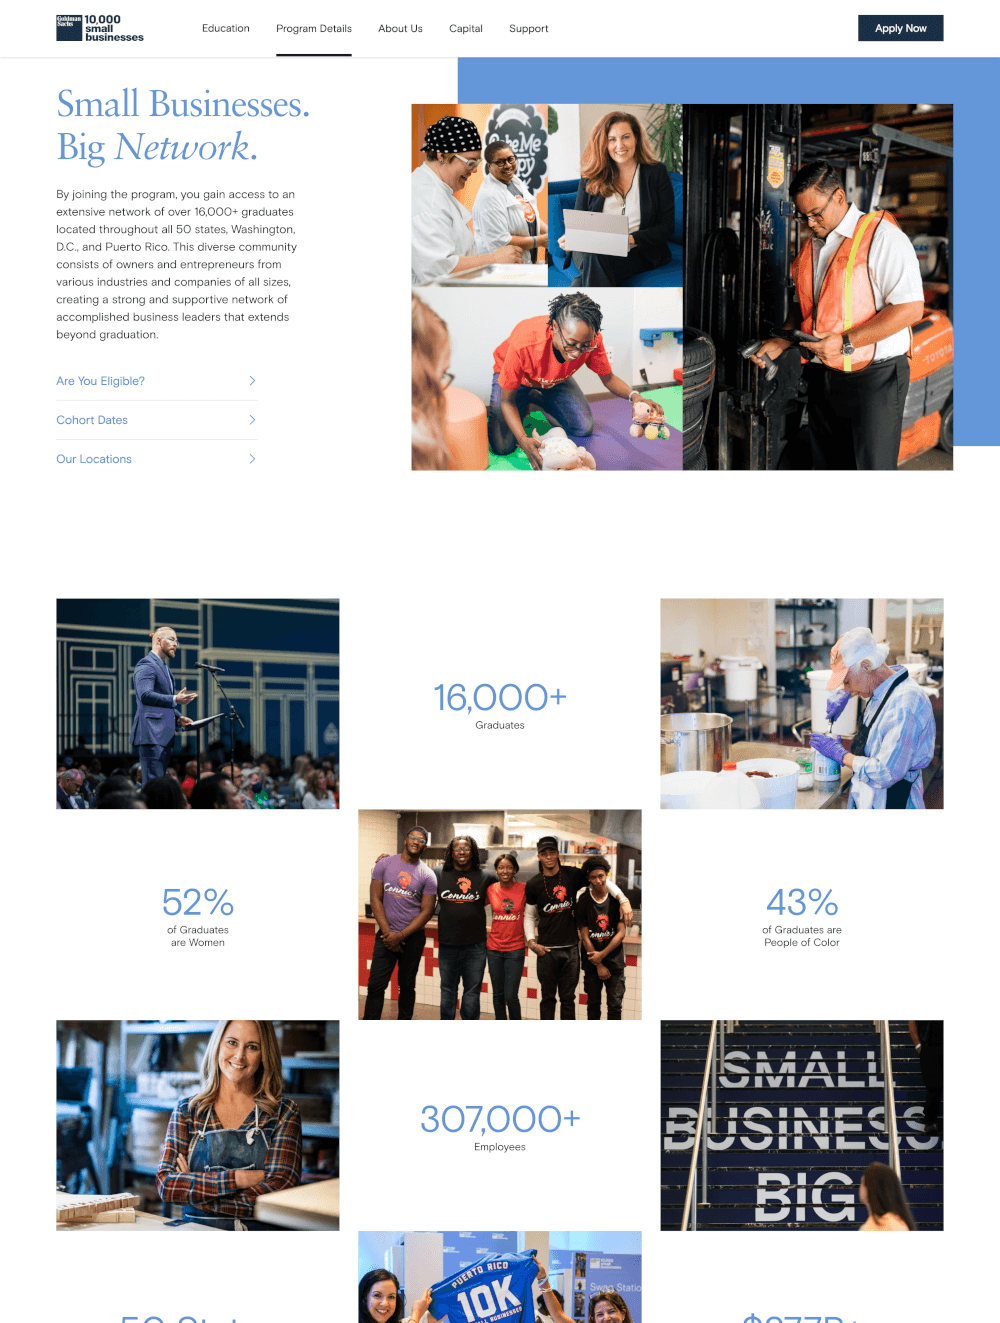
2,786
Views
2,010
Active Users
1.39
Sessions
1m 01s
AVG Engagement Time
8,429
Events
/Education
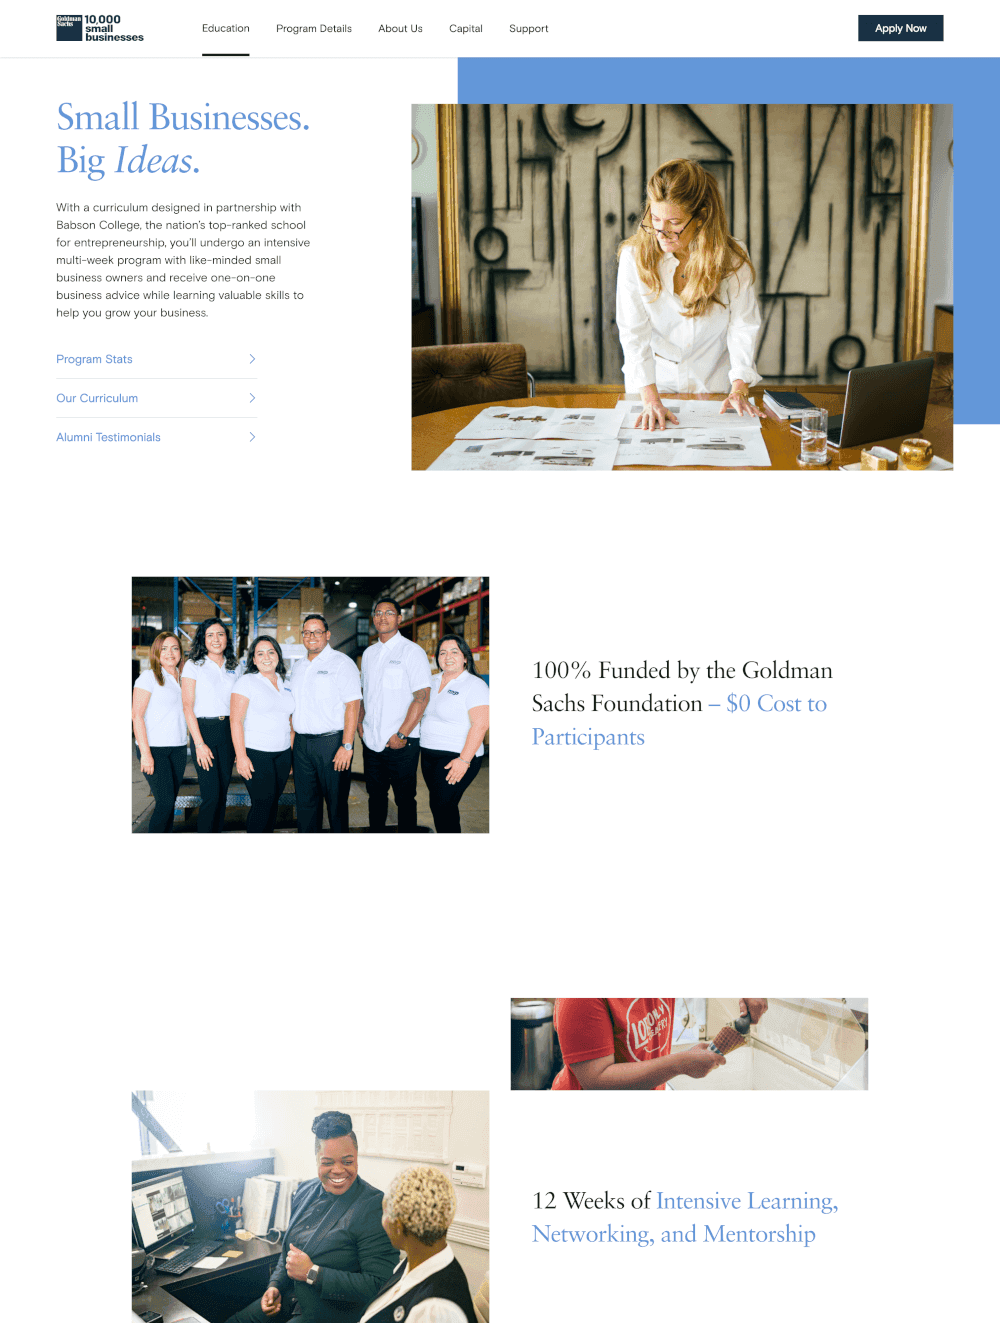
1,246
Views
823
Active Users
1.51
Sessions
51s
AVG Engagement Time
3,203
Events
/About-us
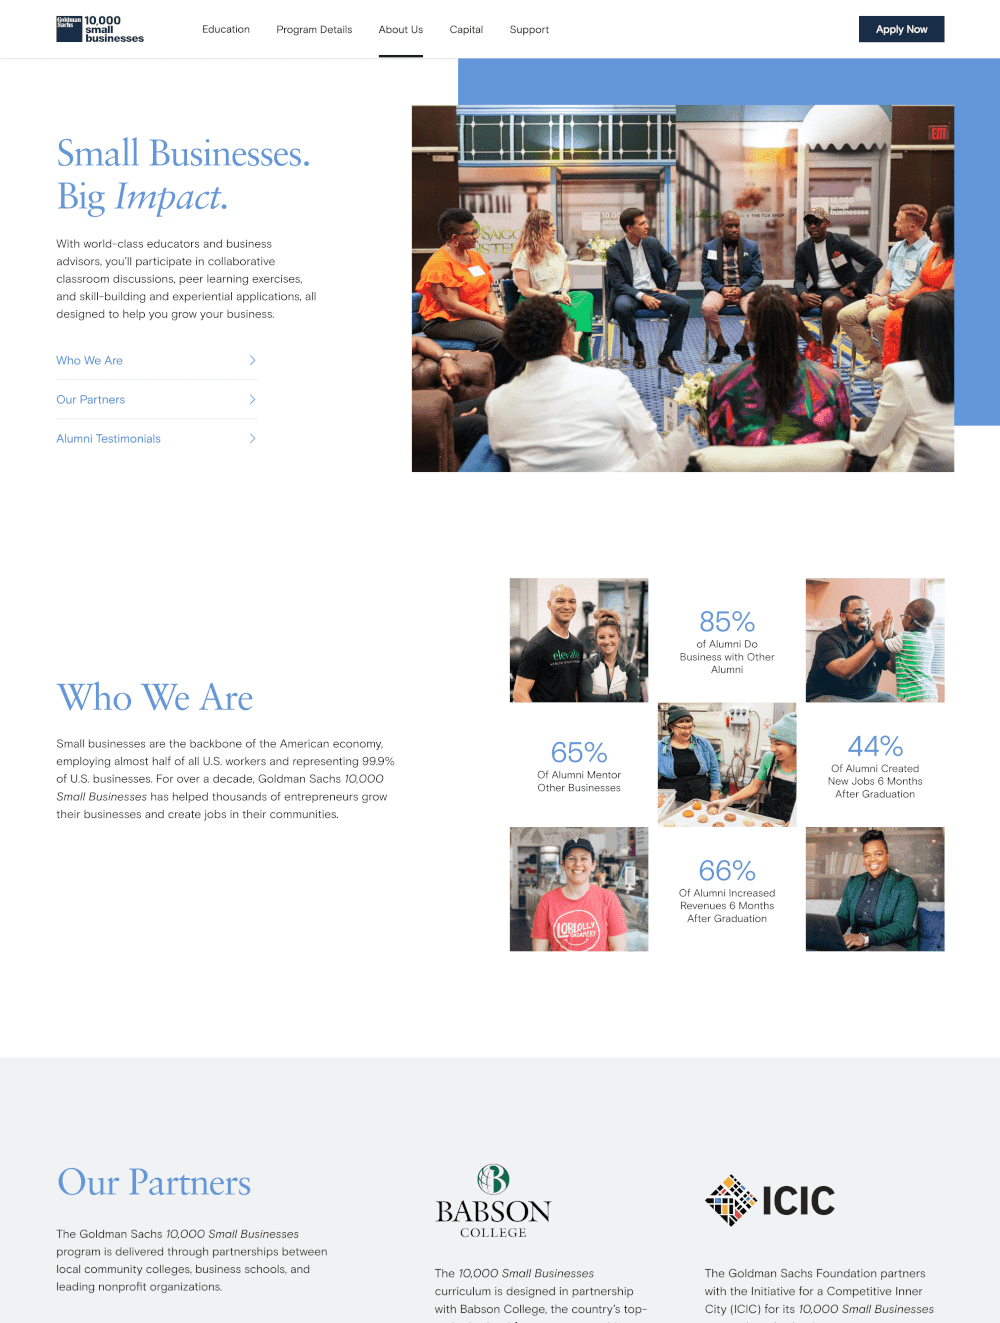
883
Views
715
Active Users
1.23
Sessions
28s
AVG Engagement Time
2,501
Events
/Capital
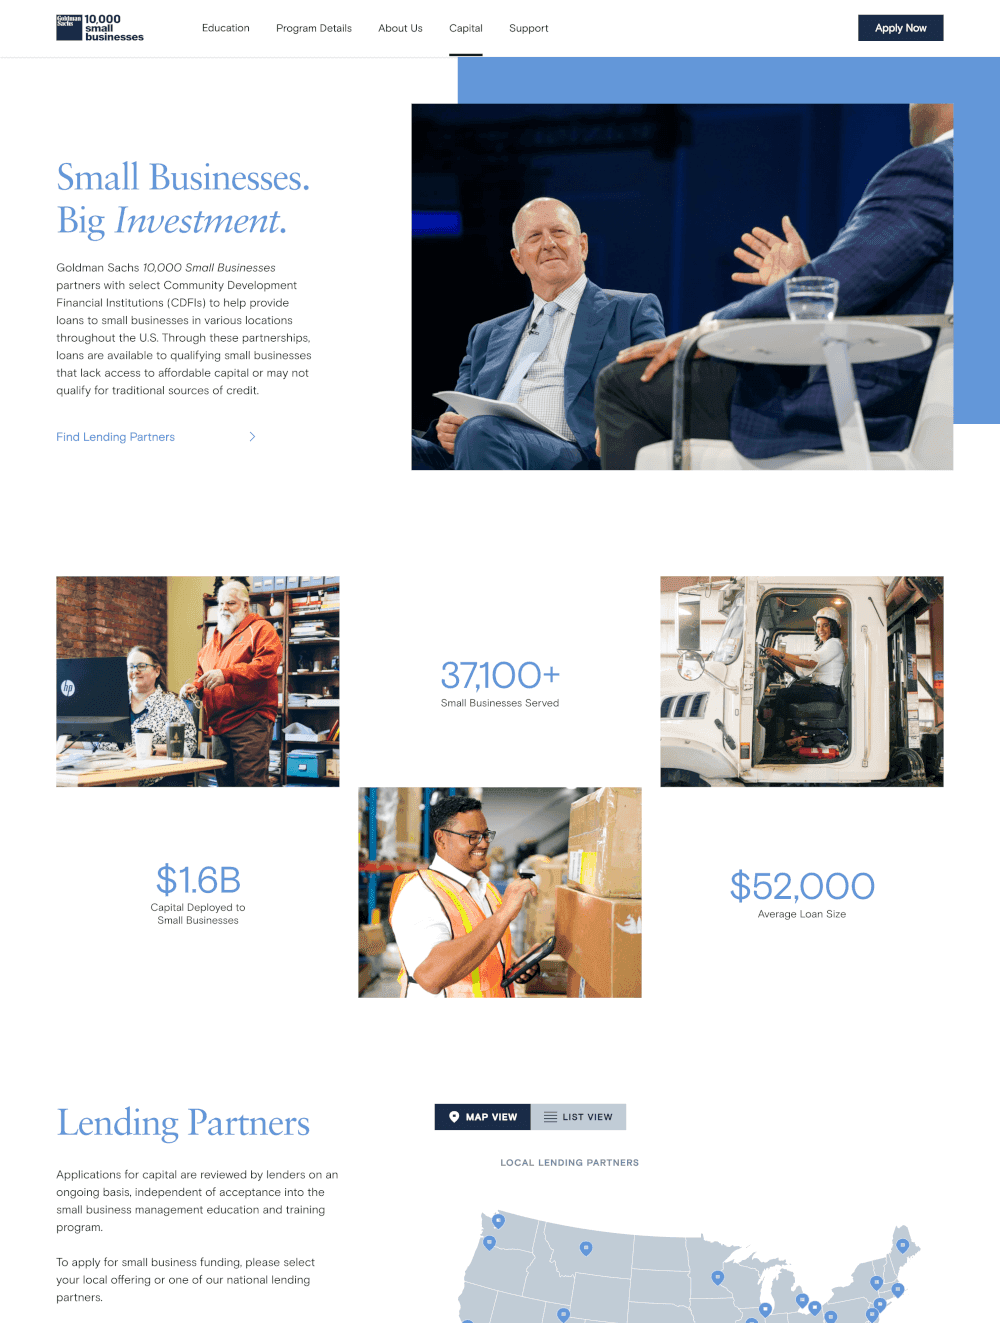
379
Views
315
Active Users
1.20
Sessions
28s
AVG Engagement Time
1,049
Events